Understanding Key Performance Indicators (KPIs) – Complete Guide
Data Analysis
Index (What you will learn)
For example: Visits, Pageviews, Revenue etc are number metrics because they are in the form of numbers.
Bounce rate, Conversion rate, Average order value etc are ratio metrics because they are in the form of ratios.
Conversion rate, Average order Value, Task completion rate etc are ratio KPIs.
Revenue per click, Revenue per visit, Revenue per acquisition, Cost per acquisition, Task completion rate etc. are other examples of metrics which can be used as KPIs.
If you are not sure whether or not a metric can be used as a KPI, then try to correlate it with revenue, cost and/or conversions over a period of time (3 or more months).
Even if somehow you are able to correlate the number of twitter followers with revenue, cost and/or conversions you still need to prove that the correlation has huge impact on the business bottomline.
i.e. as the number of facebook fan increases or decreases there is a corresponding increase or decrease in revenue, cost and/or conversions.

Even if somehow you are able to correlate the number of facebook fans with revenue, cost and/or conversions you still need to prove that the number of facebook fans has huge impact on the business bottomline.
You can easily track phone calls through ‘phone calls tracking’ software and then import phone calls data into Google Analytics. Once the data is imported you can tie phone calls to revenue, cost and/or conversions to determine correlation.
Here there is one thing to keep in mind.
For example ‘Phone call’ metrics is not available in Google Analytics reports by default but this doesn’t mean that we can’t use it as a KPI.
Similarly, ‘Task completion Rate’ metric is not available in Google Analytics reports. However you can calculate ‘Task completion Rate’ through a survey tool like Qualaroo and use it as a KPI.
For example ‘Bounce Rate’ is a good Internal KPI for optimizing landing pages. But it is not something which you will report to a CEO. We report only hugely business bottomline impacting KPIs to senior management.
1. Available and MeasurableYou can use only those metrics as KPIs which are available to you in the first place. For example if ‘Net Promoter Score’ metric is not available to you then you can’t use it as a KPI.
Similarly if you come up with something which is impossible to measure (like ‘frustration level of customers who abandoned the shopping cart for the 3rd time’) then you can’t use it is as a KPI.
So when you are finding your KPI,
2. Hugely business bottomline impactingIf a metric does not greatly impact the business bottomline then it is not a good external KPI.
3. RelevantIf your KPI is hugely business bottomline impacting then it is got to be relevant to your business objectives. Conversely, if your KPI is not relevant to your business objectives then it can’t be business bottomline impacting either.
4. Instantly usefulIf your KPI is hugely business bottomline impacting then it is got to be instantly useful i.e. you can quickly take actions on the basis of the insight you get from your KPI.
5. TimelyYour KPI should be available to you in a timely manner so that you can take timely decisions.
For example if you are using a compound metric (a metric which is made up of several other metrics) as a KPI and it takes several months to compute it once and then another several months to compute it second time then it is not a good KPI as you can’t take timely decisions on the basis of such KPI.
There is virtually no limit to the number of good KPIs you can find.
It all depends upon the nature of the business and the industry you work in.
For example if you work in an industry where majority/all of the conversions happen offline via phone calls then you can use ‘Phone Calls’ as your KPI.
Read more: http://www.optimizesmart.com/understanding-key-performance-indicators-kpis-just-like-that/#ixzz3lpFDahcl
Index (What you will learn)
#1 What is a KPI
#2 Difference between a Metric and KPI
#3 How to find a good KPI
#4 Can you use ‘number of twitter followers’ as a KPI
#5 Can you use ‘number of facebook fans as a KPI
#6 Can you use ‘Phone Calls as a KPI
#7 Can you use Clients’ Happiness as a KPI
#8 Types of KPIs (Internal & External)
#9 Attributes of a Good KPI
#10 Examples of Good KPIs
What is a KPI?
KPI stands for ‘Key performance Indicator’.It is a metric which is used to determine how you are performing against your business objectives.A metric can be a number or a ratio. So we can have ‘number metrics’ and we can have ‘ratio metrics’.
For example: Visits, Pageviews, Revenue etc are number metrics because they are in the form of numbers.
Bounce rate, Conversion rate, Average order value etc are ratio metrics because they are in the form of ratios.
Since KPI is also a metric, we can have KPIs in the form of numbers and ratios. So we can have ‘number KPIs’ and we can have ‘ratio KPIs’.For example: Days to purchase, visits to purchase, Revenue etc are number KPIs.
Conversion rate, Average order Value, Task completion rate etc are ratio KPIs.
Difference between a Metric and KPI
A metric graduates to KPI.However in order to make this happen the metric must hugely impact the business bottomline. This is possible only when the metric has the ability to provide recommendation(s) for action which can a huge impact on the business bottomline. So
Your KPI must have the ability to provide recommendation(s) for action which can hugely impact the business bottomline.For example, ‘Average Order Value’ can be used as a KPI because it hugely impacts the business bottomline. You can greatly increase sales at the present conversion rate just by increasing the size of the orders.
Revenue per click, Revenue per visit, Revenue per acquisition, Cost per acquisition, Task completion rate etc. are other examples of metrics which can be used as KPIs.
How to find a good KPI
1. Before you start the process of finding KPIs, you must acquire a very good understanding of your business and its objectives.You will use these KPIs to measure the performance of each goal.
2. Then you need to translate your business objectives into measurable goals.
3. Once you have determined your goals, you will select KPIs for each of these goals.
Goals are specific strategies you used to achieve your business objectives.Your business objective can be something like ‘increase sales’. Your goal could be something like ‘increase sales by 5% in the next 3 months by increasing the average order value from x to 2x’.
Any metric which has the ability to directly impact the cash flow (revenue, cost) and/or conversions (both macro and micro conversions) in a big way can be a good KPI.For example if you sell display banner ad space on your website and display advertising is the main source of revenue for you then ‘pageviews’ can be used as a KPI. The more pageviews you get, the more you can charge for every thousand impressions (CPM) from your advertisers.
If you are not sure whether or not a metric can be used as a KPI, then try to correlate it with revenue, cost and/or conversions over a period of time (3 or more months).
You need to prove that there is a linear relationship between your chosen KPI and revenue, cost and/or conversions
i.e. as the value of your KPI increases or decrease there is a corresponding increase or decrease in revenue, cost and/or conversions.
Can you use ‘number of twitter followers’ as a KPI
The answer is ‘NO’, not unless you can correlate number of twitter followers with revenue, cost and/or conversions i.e. as the number of twitter followers increases or decreases there is a corresponding increase or decrease in revenue, cost and/or conversions.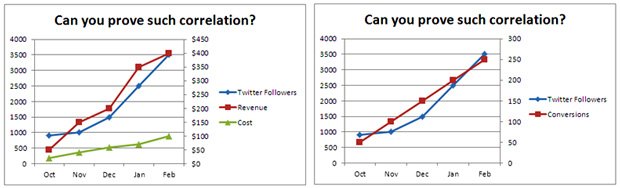
Just because a metric impacts the business bottomline, does not automatically make it a good KPI.
Can you use ‘number of facebook fans as a KPI
The answer is ‘NO’, not unless you can correlate number of facebook fans with revenue, cost and/or conversionsi.e. as the number of facebook fan increases or decreases there is a corresponding increase or decrease in revenue, cost and/or conversions.
Even if somehow you are able to correlate the number of facebook fans with revenue, cost and/or conversions you still need to prove that the number of facebook fans has huge impact on the business bottomline.
Just because a metric impacts the business bottomline, does not automatically make it a good KPI.
Can you use ‘Phone Calls as a KPI
The answer is ‘yes’ provided majority of your revenue comes through Phone calls.You can easily track phone calls through ‘phone calls tracking’ software and then import phone calls data into Google Analytics. Once the data is imported you can tie phone calls to revenue, cost and/or conversions to determine correlation.
Here there is one thing to keep in mind.
A KPI doesn’t need to be a metric available in Google Analytics reports.You can use metrics from other analytics tools too.
For example ‘Phone call’ metrics is not available in Google Analytics reports by default but this doesn’t mean that we can’t use it as a KPI.
Similarly, ‘Task completion Rate’ metric is not available in Google Analytics reports. However you can calculate ‘Task completion Rate’ through a survey tool like Qualaroo and use it as a KPI.
Task completion rate is the percentage of people who came to your website and answered ‘yes’ to this survey question: “Were you able to complete the task for which you came to the website?”
Can you use Clients’ Happiness as a KPI
The answer is ‘NO’. This is because a KPI is a metric and metric is a number or a ratio. In other words,metrics is something which can be measured in the first place.How you can possibly quantify a human emotion like ‘Happiness’?
Types of KPIs
There are two broad categories of KPIs:- Internal KPIs
- External KPIs
Internal KPIs
These KPIs are internally used by team members to measure and optimize their marketing campaigns’ performance. They are not always reported to clients/boss/senior management.Internal KPIs don’t need to be business bottomline impacting either.For example following KPIs can be used to measure your link building outreach campaigns:
- Delivery Rate
- Open Rate
- Response Rate
- Conversion Rate of outreach
- ROI of outreach
For example ‘Bounce Rate’ is a good Internal KPI for optimizing landing pages. But it is not something which you will report to a CEO. We report only hugely business bottomline impacting KPIs to senior management.
Related Post: How to become Champion in Data Reporting
External KPIs
These are the KPIs we report to clients/senior management and use them to create ‘Web Analytics Measurement Models’ (strategic roadmaps) for businesses.External KPIs must be hugely business bottomline impacting.Whenever we talk about KPIs in general, we are referring to external KPIs. Some examples of external KPIs:
- Average Order Value
- Conversion Rate
- Revenue
- Revenue per acquisition
- Cost per acquisition
- Task Completion Rate
- Goal conversions
Attributes of a Good KPI
A Good KPI has following attributes:1. Available and MeasurableYou can use only those metrics as KPIs which are available to you in the first place. For example if ‘Net Promoter Score’ metric is not available to you then you can’t use it as a KPI.
Similarly if you come up with something which is impossible to measure (like ‘frustration level of customers who abandoned the shopping cart for the 3rd time’) then you can’t use it is as a KPI.
So when you are finding your KPI,
you need to be 100% sure that there is a mechanism/tool available out there to measure and report your KPI in the first place.
2. Hugely business bottomline impactingIf a metric does not greatly impact the business bottomline then it is not a good external KPI.
3. RelevantIf your KPI is hugely business bottomline impacting then it is got to be relevant to your business objectives. Conversely, if your KPI is not relevant to your business objectives then it can’t be business bottomline impacting either.
4. Instantly usefulIf your KPI is hugely business bottomline impacting then it is got to be instantly useful i.e. you can quickly take actions on the basis of the insight you get from your KPI.
5. TimelyYour KPI should be available to you in a timely manner so that you can take timely decisions.
For example if you are using a compound metric (a metric which is made up of several other metrics) as a KPI and it takes several months to compute it once and then another several months to compute it second time then it is not a good KPI as you can’t take timely decisions on the basis of such KPI.
Examples of Good KPIs
| KPI | Meaning | Formula | |
| 1 | Gross Profit | It is the profit after production and manufacturing cost. | Gross Profit = Sales Revenue – Direct Cost Direct cost can be something like cost of manufacturing a product |
| 2 | Gross Profit Margin | It is used to determine the effectiveness of your business in keeping production cost in control. Higher the gross profit margin, more the money is left over for operating expenses and net profit. | Gross Profit Margin = (Gross Profit/ Revenue) * 100 |
| 3 | Operating Profit | It is the profit before interest and taxes. | Operating Profit = Sales Revenue – Operating Cost Operating cost is the ongoing cost of running a business, product or system. It can include both direct and indirect costs. |
| 4 | Operating profit margin | It is used to determine the effectiveness of your business in keeping operating cost in control. Higher the operating profit margin, more the money is left over for net profit. | Operating Profit Margin = (Operating Profit/ Revenue) * 100 |
| 5 | Net Profit | Also known as net income, net earnings, bottomline. It is the profit after interest and taxes. | Net Profit = Sales Revenue – Total cost (this includes any direct and indirect cost + interest + taxes) |
| 6 | Net Profit Margin | Also known as profit margin, net margin, net profit ratio. . It is used to determine the effectiveness of your business in converting sales into profit. Low profit margin indicates higher risk, that a decline in sales will erase the profit and result in net loss. | Net Profit Margin = (Net Profit/ Revenue) * 100 |
| 7 | Revenue Growth Rate | Also known as sales growth rate. It is the measure of the percentage increase in sales between two time periods. | Revenue Growth Rate = (Current month’s Revenue- Last month’s Revenue) / (Last month’s Revenue) * 100 |
| 8 | Total Economic Value | It is the total value added by your product/service/campaigns to the business bottomline. It also take into account the role played by micro conversions and conversions which assisted and completed the sales. | Total Economic Value = Total Revenue+ Total value of the assisting conversions + Total value of the last click conversions |
| 9 | Return on Investment (ROI) | It is used to evaluate the efficiency of your investment or to compare the efficiency of different investments. | ROI= (Gain from investment – cost of investment)/cost of investment |
| 10 | Net Promoter Score | It tells how likely it is that your customers will recommend your business to a friend or colleague. Click here for more details. | Net promoter score = % of promoters – % of detractors |
| 11 | Customer lifetime value | It is the projected revenue (repeat business) a customer will generated during his lifetime. Different types of customers have different life time value (LTV). One of the best ways to boost LTV is by improving customer satisfaction. | (Average order value) X (Number of Repeat Transactions) X (Average customer life span in months/years) Average customer life span means how long he/she remains your customer. |
| 12 | Customer retention rate | It is used to determine how good your company is in retaining customers. | Customer Retention Rate = [1- (Customers lost in a given time period/total number of customers acquired in the same time period)] * 100 |
| 13 | Customer profitability score | This score is used to separate profitable customers from unprofitable customers. | Customer profitability score = Revenue earned through a customer – cost associated with customer’ management/service/retention |
| 14 | Cost per lead | It is the average cost of generating a lead. | Cost per lead = total cost/total leads |
| 15 | Cost Per Acquisition | It is the average cost of acquiring a customer or generating a conversion | Cost Per Acquisition = Total Cost/ Total acquisitions |
| 16 | Revenue Per Acquisition | It is the average revenue earned through an acquisition | Revenue Per Acquisition = Total Revenue/Total acquisitions |
| 17 | Per Visit Value | It is the average value of a visit to your website. | Per Visit Value = Total Revenue/Total Visits |
| 18 | Conversion Rate | It is the percentage of visits which results in goal conversions or ecommerce transactions. | Conversion Rate = (Total Goal conversions/ E-commerce transactions/ total visits) *100 |
| 19 | Average Order Value | It is the average value of an ecommerce transaction. Through this metric you can measure how effective your upselling and cross selling efforts are and whether you are helping people in finding the product they are looking for. | Average order value = Total Revenue/Total ecommerce transactions |
| 20 | Task Completion Rate | It is the percentage of people who came to your website and answered ‘yes’ to this survey question: “Were you able to complete the task for which you came to the website?” | Task completion rate = (number of people said ‘yes’ to the survey question/ Total number of survey responses) *100 |
There is virtually no limit to the number of good KPIs you can find.
It all depends upon the nature of the business and the industry you work in.
For example if you work in an industry where majority/all of the conversions happen offline via phone calls then you can use ‘Phone Calls’ as your KPI.
Other Posts you may find useful: Complete Guide to Google Adwords Analytics
Subscribe to my blog
Join my free newsletter and learn to avoid the analytics mistakes everyone seems to be making over and over again.
Read more: http://www.optimizesmart.com/understanding-key-performance-indicators-kpis-just-like-that/#ixzz3lpFDahcl
Comments
Post a Comment